
What’s Happening to London’s Population?
An Historical Introduction
London’s population peaked in the 1930s, reaching about 8.6 million in 1939. For the next half century it fell steadily, to 6.8 million in the 1980s, before beginning to rise again, to over 9.1 million now. But the experiences of inner London (broadly, the area governed by the London County Council (LCC) from 1889 to 1963) and of outer London (broadly, the areas added to the county when the Greater London Council (GLA) was created in 1965) have differed greatly.
Inner London’s population fell rapidly by over 40%, from 4.6 million to 2.6 million between the 1930s and the 1980s. By contrast, the outer London population rose from around 3.5 million in the 1930s to 4.5 million in the 1960s, before falling slightly to 4.2 million in the 1980s. Since then, both inner and outer London have grown by over a million people, to around 3.7 million in inner London, and 5.5 million in outer London.
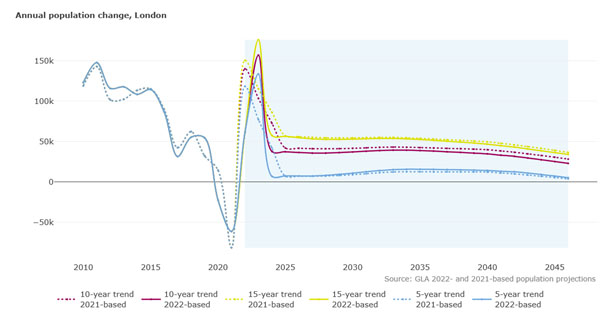
London recent population change
The rate of growth has been higher in inner than in outer London; but inner London’s population is still over a million smaller than it was in 1931. And the growth has been slowing: the GLA’s latest projections for growth across London to the 2040s are the lowest they have been since 2011.
The Components of Change
It is helpful to consider the three components of change: births, deaths, and migration.
What is often termed the natural rate of population growth arises from the difference between the numbers of deaths and of births. In the 12 years from 2012 to 2023, the excess of births over deaths contributed over 850k to the growth in London’s population. In recent years, the numbers of deaths have tended to rise, and the numbers of births, while still around 50k higher than the numbers of deaths, have tended to fall. The excess of births over deaths is still the main determinant of population growth, but the fall in the number of births, and the rise in deaths, are projected to continue into the 2040s, meaning lower growth overall.
Migration, both into and out of London, and to and from both the rest of the UK and the rest of the world, has also declined in importance in recent years. The net gain from migration fell from 49k in 2014 to minus 17k in 2020; and the GLA’s projections all show that net loss continuing into the 2040s.
Births
Annual births in London rose by around 30 per cent over the decade from 2002 to 2012, but since the peak of 134k in 2012, the number of births has fallen steadily, a fall that has accelerated since 2017. Between 2012 and 2023, the number has fallen by over 21%, from 134k to 105k, with particularly sharp falls of well over a thousand births across south-west London, from Lambeth and Wandsworth to Richmond and Merton. Only one London borough, Havering, saw a small increase in births between 2012 and 2023.
Deaths
Between 2012 and 2018, the number of deaths remained reasonably steady, at around 48k. Not surprisingly, it increased to over 59k in 2020; and although it fell in the three following years, it has not reached pre-pandemic levels. In 2023 it rose again slightly, to over 53k, 12% higher than in 2012. The rise in deaths is distributed across inner and outer London, with particularly high rates in Brent (28%) and Hounslow (20%). By contrast, there were only modest increases of around 4% in the number of deaths in Kensington and Chelsea and in Westminster.
Migration
It is useful to distinguish between domestic and international migration. Domestic emigration – people moving out of London to the rest of the UK – rose from around 250k in 2010 to over 350k in 2019, before falling in the pandemic. But it is worth stressing just how many people are leaving London each year. There is of course also a substantial inflow of people from the rest of the UK, but it is significantly smaller. Around 200k people moved to London from elsewhere in the UK in 2010, and this figure rose to 250k in 2019, before falling during the pandemic. The key point is that the difference between domestic emigration and immigration rose from c 50k to c100k in the decade up to 2020. Substantially more UK people moved out of London than into it, and this net loss is projected to continue.
For international migration, the picture is rather different. The number of people coming from overseas to London has fluctuated at around 200k a year, while the number moving out of London has fluctuated at around 100k. This positive net inflow, however, is not sufficient to offset the net outflow of people from the rest of the UK.
Two further points are worth stressing. First, migration into London, especially inner London, is concentrated overwhelmingly on 20-24 year-olds, and to a much lesser extent, 25-29 year-olds. All other age groups show net outflows.
Second, migration figures vary significantly from year to year across both inner and outer London boroughs. Over the past twelve years few boroughs – apart from Havering and Tower Hamlets, which had net gains every year except 2021 and 2020 respectively – show consistent patterns of net gain or loss from year to year. The figures were of course affected by the pandemic, and it is notable that in 2022, Camden, Islington, and Kensington and Chelsea each saw a net gain after consistent losses in previous years.
Place of birth and ethnicity
Most people in London – 5.2 million – were born in the UK; and they represent 59% of the total population. The next largest group – 1.3 million – were born elsewhere in Europe, with the largest contingents from Romania and Poland. There are 1.2 million born in Asia, with 323k from India. Around 250k were born in North and Central America; and 150k in South America.
London is significantly more diverse than England as a whole. In the 2021 Census, 46% of London residents identified with Asian, black, mixed or ‘other’ ethnic groups, and a further 17% with white ethnic minorities. But once more there are large variations across London. Ten boroughs have a majority non-white population. In Newham 69.2% of people are non-white, and the figure is above 60% in Brent, Redbridge, Harrow and Tower Hamlets. But in Richmond upon Thames only 19.5% of the population is non-white, in Bromley 23.5% and in Havering 24.7%. Further, if we examine the Asian group, for example, we find large communities in East London – such as Redbridge (47.3%) – and West London, such as Harrow (45.2%). But if we look closer, we find that the Indian community tends to be concentrated in west London, that the Bangladeshi community is heavily concentrated in east London boroughs such as Tower Hamlets, while the Pakistani community is more evenly spread across London.
Age Profile
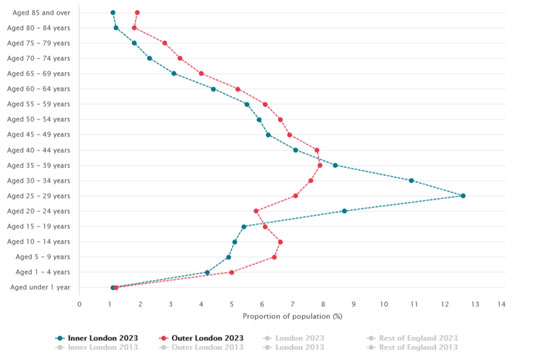
Population age profile 2023
The age profile of London’s, particularly inner London’s, population is markedly different from most of the rest of the UK. Nearly a quarter (23.5%) of inner London’s population is aged between 25 and 34, compared to compared to 14.7% in outer London, and 12.3% in the rest of England. This is the result of people in their 20s coming to London to pursue their early careers, before moving out, typically in their 30s, when they start families. It is notable, however, that the median age of London’s population has risen from 34 to 36 since 2001, following the national trend. But in contrast to London, in cities such as Birmingham and Manchester with large university complexes, median ages have fallen over the past decade, as inward migration has risen, and at an earlier age. Once more, however, there are huge differences between London boroughs, where, for example, Barking and Dagenham has bucked the overall London trend with a fall in median age over the past decade; and Tower Hamlets has the lowest median age (30.6) of any local authority in the UK.
In the past decade, the falling number of births combined with migration out of London, has brought a significant decrease in number of young children. In Inner London, children aged 0-9 comprised 12.6% of the population in 2013; but by 2023 that had fallen to 10.2%. In Outer London the figures were 14.1% and 12.6% respectively. Across London, as a result, the population of 0-9-year-olds fell by nearly 100k, at a time when the overall population rose by over 500k. London’s loss of children has been offset by increases in counties such as Kent, where in contrast to Westminster’s fall of 21% in the numbers of primary-school-age children, Dartford saw a 26% increase. The loss of young children in London brings a number of problems; and one obvious result is that the proportion of London’s population in all other age-groups has increased.
Conclusion
The brief outline of some key changes in London’s population presented in this article is based on data from a range of sources including the Office of National Statistics, the GLA, the Trust for London, the Resolution Foundation and other sources. I am of course responsible for any errors, but I hope that it provides a useful account on which more detailed analysis can build.
London’s population continues to grow, but at a slower pace than in the past two decades. The components of change have some obvious and profound implications for London’s economy and growth, for its businesses, and for a wide range of public services, including education, transport, social services, housing, planning, the building of its infrastructure, and many other services. As we move towards a new London Plan, I hope that members of the London Forum will begin to explore some of the implications in subsequent articles.
Michael Jubb
Chair, London Forum
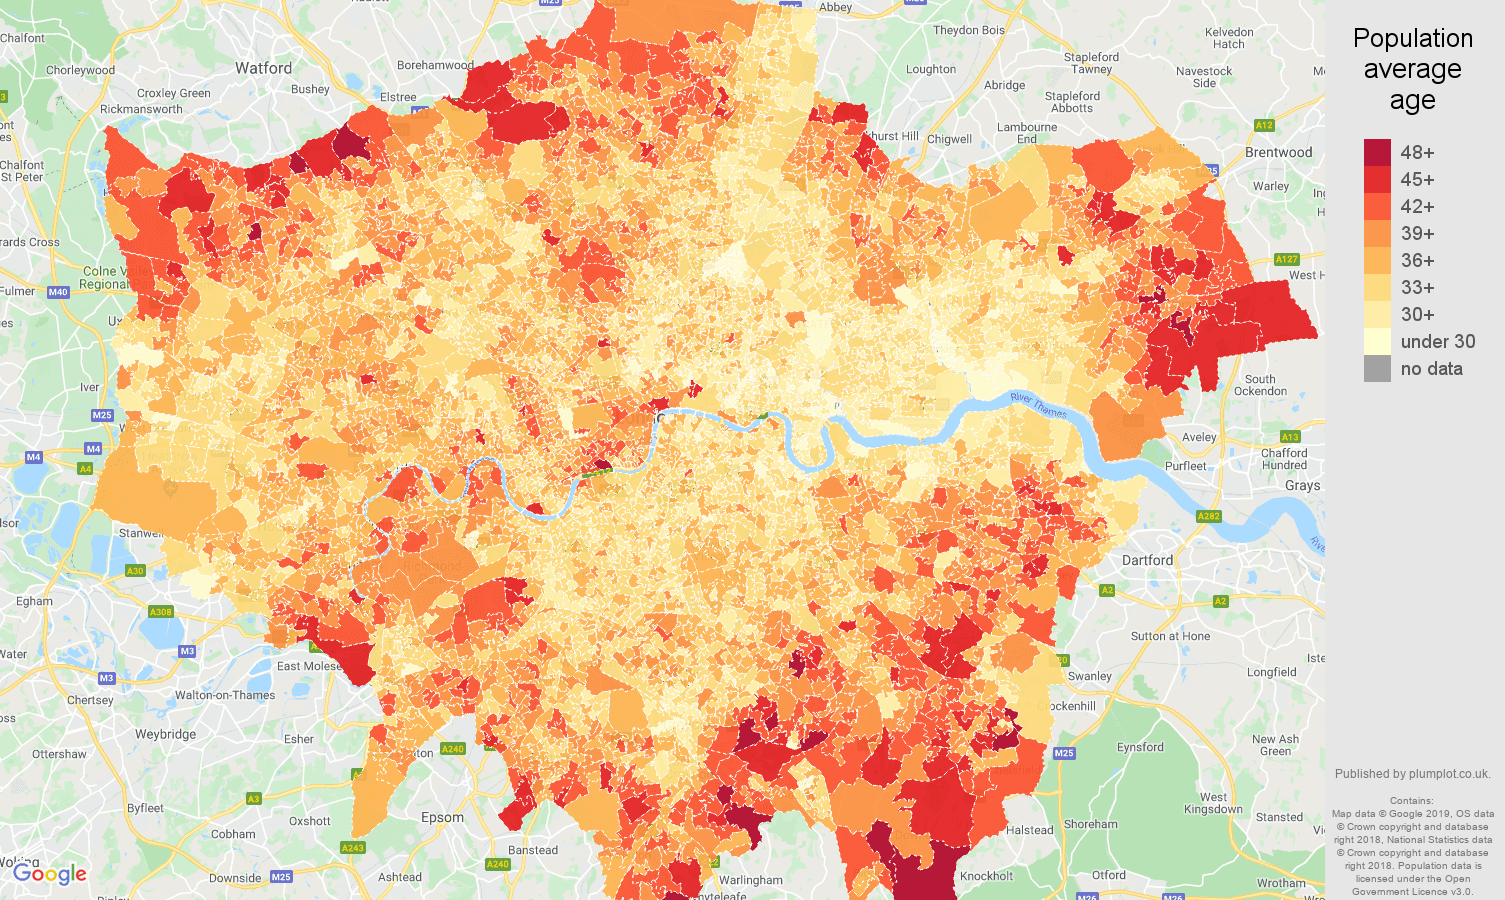
London population average age 2018
All Tags

The Role of Civic Societies in London’s Planning and Development
What role do civic societies really play in shaping London? Are they powerful defenders of local communities, or are they ...

Healthy Street Scorecard 2026
The annual results have been published by CPRE (London) for the Healthy Streets scores by borough.
Visit their website to ...

Modular construction in Old Kent Road
Urban Design Learning (UDL) has published another video in their series on development in the Old Kent Road Action Plan ...

Garden Annexe, Caravan, or Mobile Home?
Tim Catchpole of the Mortlake and East Sheen Society writes…
Our Society has had a recent experience which we would like to share with other London Forum members who may [more…]
Most Popular This Week


-
Member Services Committee meeting
📅 Thu 6th August | 14:00 - 16:00
🚩 Room F3 70 Cowcross St, EC1M 6EJ (map)
-
Planning, Environment and Transport committee meeting
📅 Thu 13th August | 14:00 - 16:00
🚩 Room B1 70 Cowcross St, EC1M 6EJ (map)
-
Summer drinks party at Cowcross Street
📆 Mon 24th August | 18:30 - 20:30
🚩 77 Cowcross Street, EC1M 6EL (map)
The annual summer drinks party for London Forum’s members will be held at the Alan Baxter office building at Cowcross Street. Please do come along and join Trustees and committee members for drinks and nibbles on Monday 24 August from 6.30pm to 8.30pm and meet fellow activists from other member societies across London. This is a free event for a maximum of two people per society – please use the booking facility ( https://www.londonforum.org.uk/events/summer-drinks-party-at-cowcross-street-2026/#booking ) to secure your place(s). If the weather is kind we should be able to spill…